
Blog
The RevOps ROI Metric Startups Are Not Tracking: Time
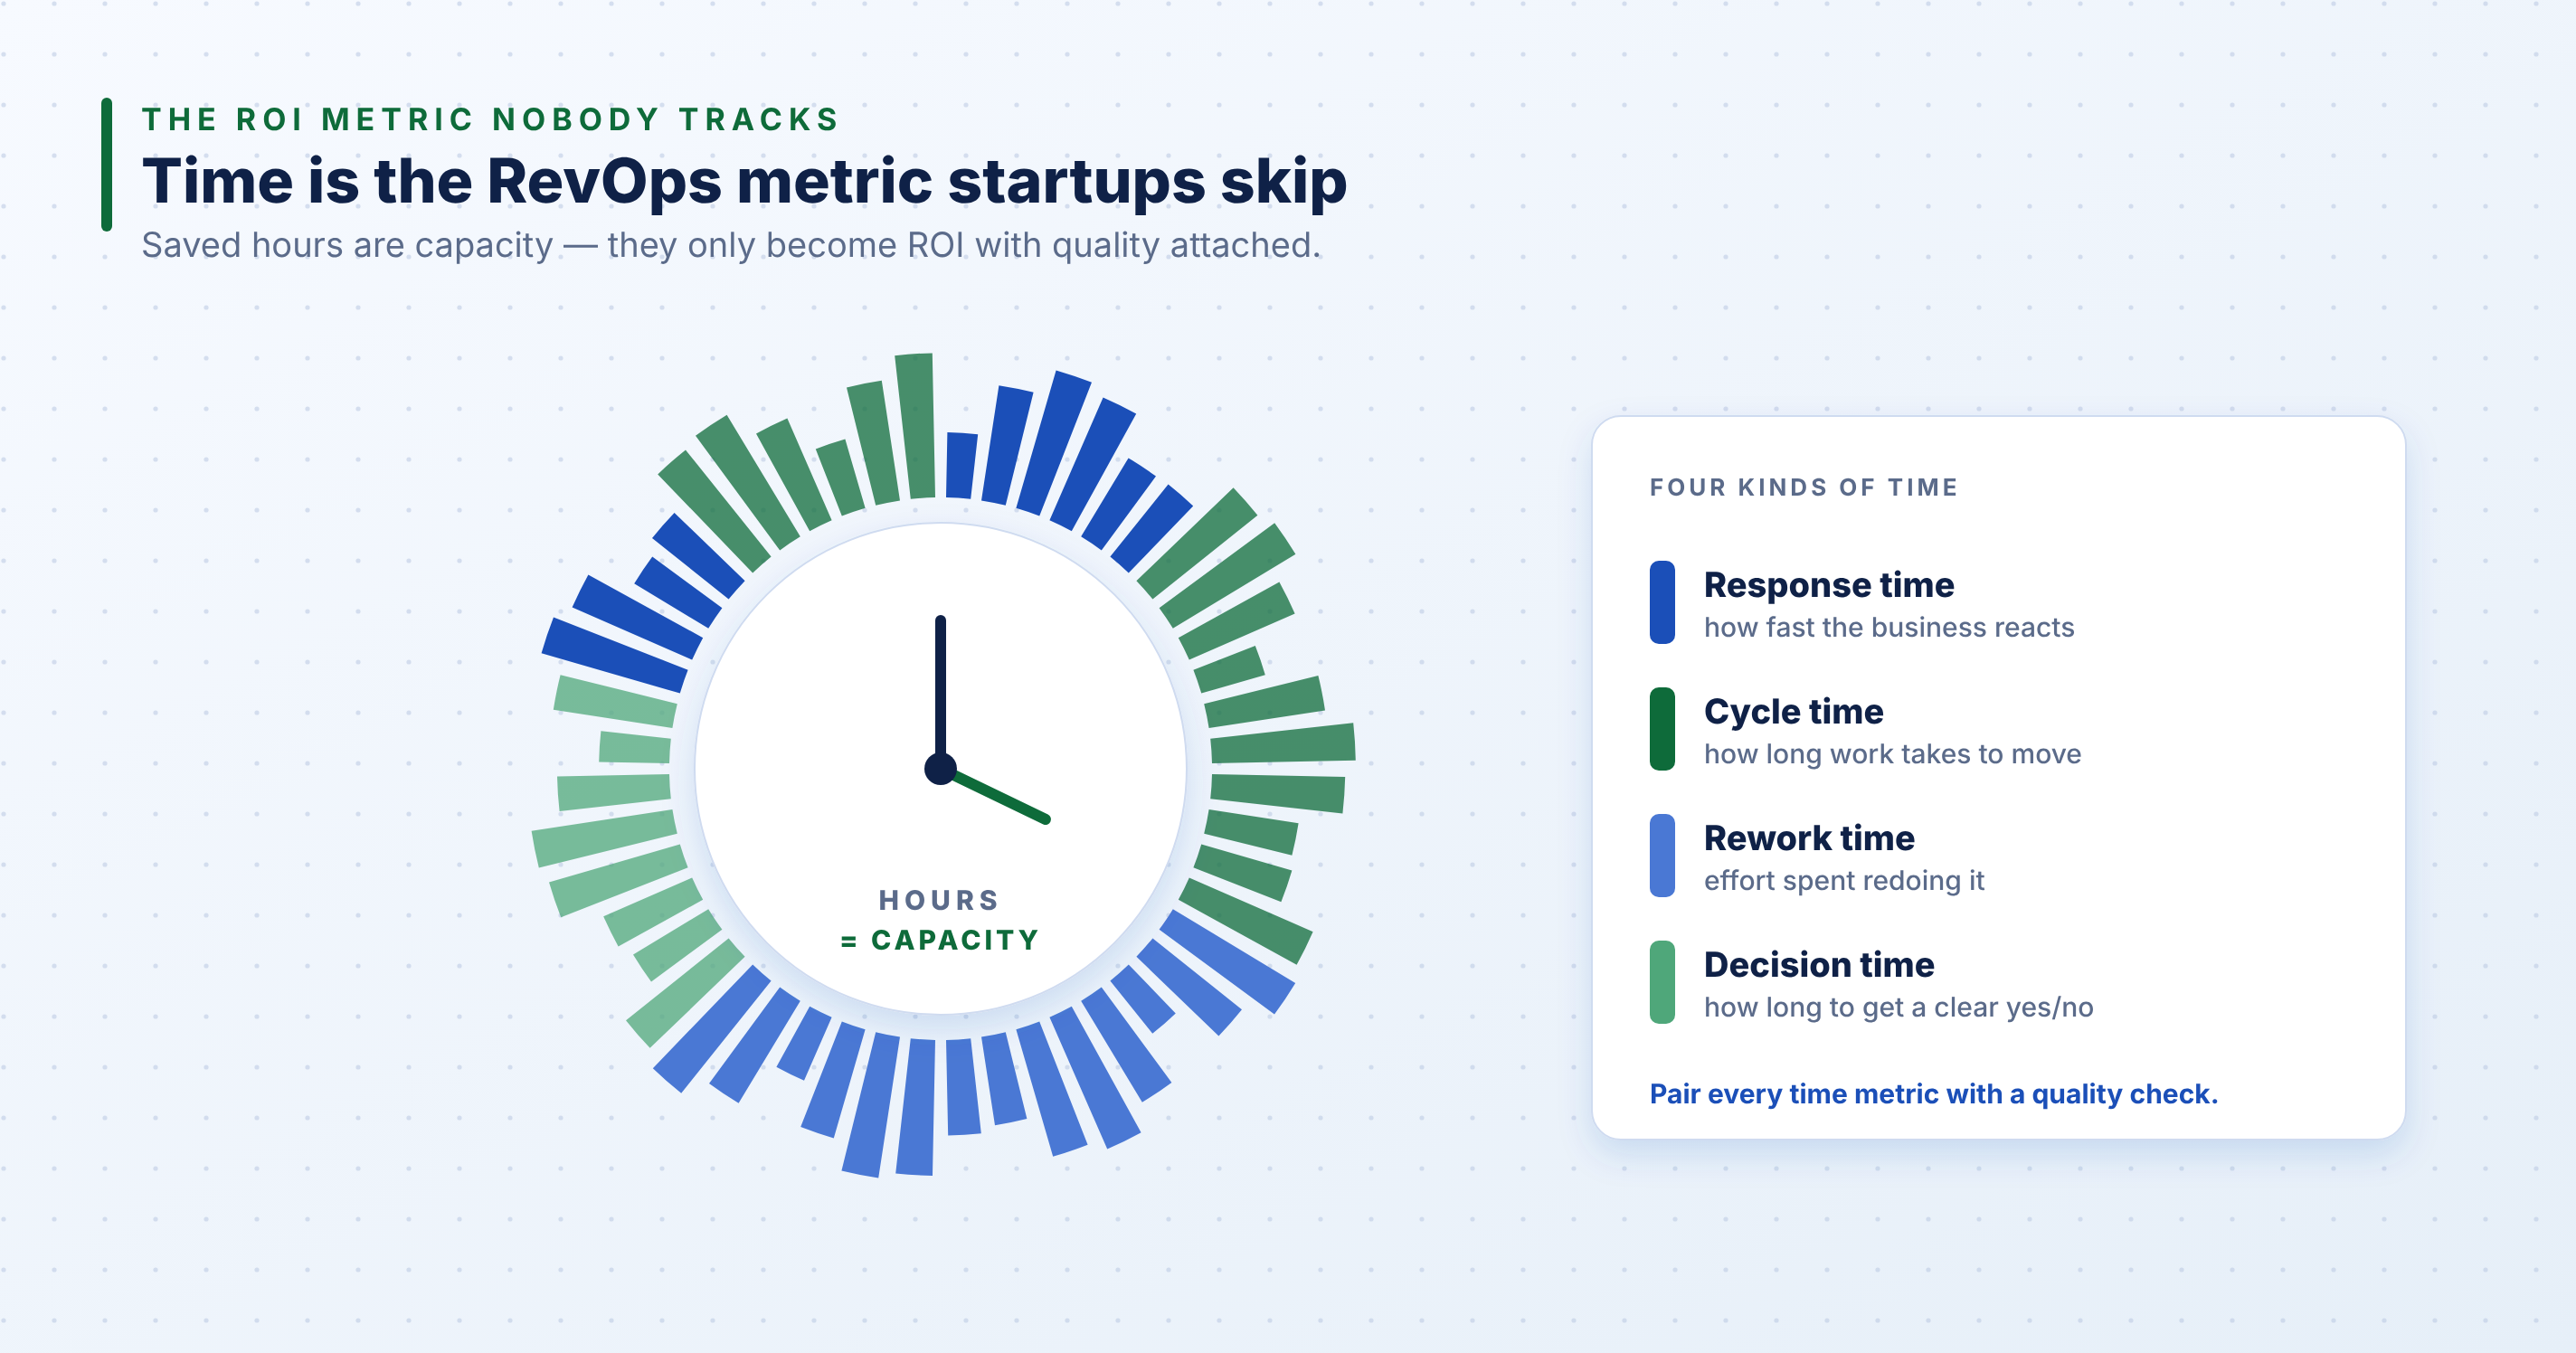
Startups often try to prove RevOps ROI with a revenue number.
Did pipeline increase? Did conversion improve? Did the forecast become more accurate? Did the automation generate more revenue?
Those questions matter. They are also difficult to answer early because revenue is affected by product, market, pricing, sales execution, marketing demand and time. A CRM rebuild or routing improvement may be essential without being solely responsible for a later deal.
The most useful leading indicator is time—not simply “hours saved,” but the time required to respond, move work forward, correct mistakes and produce an accepted outcome.
Time shows whether the revenue system is becoming easier to operate before every benefit appears in closed revenue.
The important caveat is that recovered time is capacity. It becomes financial ROI only when the company uses that capacity, removes a real cost or changes a commercial outcome.
Why revenue metrics alone cannot prove RevOps ROI
Revenue Operations influences the environment in which revenue is produced.
It can make lead assignment faster, reduce duplicate work, improve pipeline discipline, shorten reporting preparation, remove integration failures and help sellers spend more time selling. But pipeline and revenue still depend on factors RevOps does not control.
This creates two common measurement errors.
The first is claiming too much: attributing every pipeline increase after an implementation to the RevOps project.
The second is claiming too little: reporting only completed tickets, workflows or dashboards because the team cannot isolate revenue causally.
A stronger model connects operational improvement to commercial relevance without inventing certainty:
- Measure how long important revenue work takes.
- Measure the quality of the resulting outcome.
- Identify what capacity or commercial behaviour changed.
- Convert only realised changes into financial value.
Track four kinds of time
Not every hour has the same operating meaning. Start with four categories.
1. Response time
How long does it take the organisation to react to a meaningful event?
Examples include:
- Form submission to accepted owner
- High-intent signal to seller action
- Customer request to responsible team
- Forecast exception to manager review
Response time exposes delays at the start of a process. Use the median and a service-level distribution, not only the average. One extreme record can distort a small startup dataset.
2. Cycle time
How long does work take from an accepted start point to an accepted outcome?
Examples include:
- Qualified lead to first meeting
- Meeting to opportunity creation
- Opportunity stage to stage
- Campaign brief to launch
- Data issue opened to resolved
Cycle time shows where progress slows. Segment it by source, segment, owner or motion before assuming every delay is operational.
3. Rework time
How much time is spent correcting, reconciling or repeating work that should have been right the first time?
Examples include:
- Deduplicating and reassociating records
- Repairing routing exceptions
- Rebuilding reports before a review
- Correcting campaign membership or source data
- Re-entering information from one system into another
Rework is often the clearest evidence that poor data or process design is creating a recurring cost.
4. Decision time
How long does it take to turn available information into an accepted decision?
Examples include:
- Preparing an agreed forecast
- Approving a campaign audience
- Resolving ownership
- Deciding which pipeline risk needs action
- Producing the WBR or MBR view leaders actually accept
A dashboard that loads instantly does not create value if the meeting still spends an hour debating whose number is correct.
Hours saved are capacity—not automatically ROI
Suppose an automation reduces weekly reporting preparation by six hours.
It is tempting to multiply six hours by an hourly salary rate and present the result as cash saved.
That calculation describes the notional value of capacity. It does not prove that payroll fell, a contractor was removed, hiring was avoided or the team produced more revenue.
Use three levels of value:
| Level | What it means | Example |
|---|---|---|
| Gross time reduction | The process requires fewer hours | Reporting preparation falls from eight hours to two |
| Usable capacity | The freed time is available for defined higher-value work | The analyst uses six hours for campaign analysis and data controls |
| Realised economic value | A measurable cost or commercial outcome changes | Contractor spend is removed, a hire is deferred, or faster response improves accepted meetings |
Do not skip from the first row to the third.
If recovered time disappears into general busyness, the workflow may still be easier, but the financial claim should remain modest.
Pair every time metric with a quality or outcome metric
Speed can improve because a process became better. It can also improve because controls were removed or work became superficial.
Every time measure therefore needs a counterweight.
| Time metric | Pair it with |
|---|---|
| Lead response time | Correct owner rate; accepted meeting rate |
| Routing processing time | Misroute rate; exception volume |
| Campaign launch time | QA defects; suppression accuracy; tracking coverage |
| Reporting preparation time | Reconciliation adjustments; stakeholder acceptance |
| Deal-stage cycle time | Stage-exit criteria; win rate; no-decision rate |
| Data-cleanup time | New defect rate; repeated overwrite rate |
This protects the business from optimising for velocity while quality deteriorates.
For example, an automatic routing rule may assign every record in seconds. If ten percent go to the wrong owner, the automation has improved system speed while increasing organisational delay.
How to measure time without introducing another tool
Most startups can establish a useful baseline from systems they already have.
Use timestamp pairs in the CRM: created date and first assignment, qualification date and opportunity creation, stage entry and exit, issue opened and resolved.
Use workflow and integration logs for processing time, retries and exceptions.
Use calendar or activity data carefully for meeting and follow-up intervals. An activity timestamp records what the system saw, not necessarily the full work involved.
Use a short manual sample for rework that is not logged. Ask the people performing the work to record category, start, finish and outcome for two weeks. A small disciplined sample is more useful than a precise-looking estimate nobody can explain.
Document the start event, end event, eligible population and clock rule. “Lead response time” is meaningless until the team agrees whether the clock starts at submission, enrichment completion, routing eligibility or seller acceptance.
A practical 30-day RevOps ROI baseline
Week 1: Select the work that matters
Choose five to seven recurring processes connected to pipeline, customer experience or management decisions. Examples include lead routing, lifecycle qualification, forecast preparation, campaign launch and CRM correction.
Week 2: Establish timestamps and quality checks
Define the start, end, eligible population and paired quality measure. Pull historical data where it is trustworthy and manually sample where it is not.
Week 3: Quantify delay and rework
Measure medians, distributions, exceptions and hours spent correcting work. Separate tool processing time from human waiting time.
Week 4: Create an improvement ledger
For every RevOps change, record:
- Baseline time and quality
- New time and quality
- Number of eligible cases
- Gross capacity recovered
- How the capacity will be used
- Any direct cost removed
- Any commercial outcome being monitored
Review this ledger in the same operating cadence used for pipeline and campaigns. Otherwise, the value disappears after the project closes.
The Structured GTM position
The ROI of RevOps should not be reduced to either ticket counts or an inflated revenue claim.
Time provides the missing bridge.
It shows whether the company responds faster, moves work with less friction, corrects fewer mistakes and reaches trusted decisions sooner. Paired with quality, adoption, pipeline and cost measures, it creates a credible chain from operational change to commercial value.
Track the time around the revenue decision—not only the time spent inside the tool.
Then be precise about what happened to the recovered capacity.
Hours saved are not automatically money earned. But revenue systems that repeatedly waste time rarely scale efficiently.
Structured GTM can help establish the baseline, improve the process and build an operating cadence that shows where RevOps is recovering capacity—and whether the business is using it.
Sources and further reading
- Salesforce, State of Sales 2026 — 3 February 2026. Survey of 4,050 sales professionals across 22 countries; the 40% selling-time finding is self-reported vendor research.
- Pipedrive productivity research — 4 August 2026. Vendor-sponsored survey of 1,000 US professionals; directional evidence, not a universal RevOps benchmark.
- Workato workflow research — 19 March 2026. Dataset of 114 B2B companies and one personalised analysis; methods and sample limits should be retained.
- Workday employee-experience research — 2026. Supports the distinction between time saved and value realised; not RevOps-specific.
- HubSpot: Calculate time between properties — current documentation. Confirms a practical measurement mechanism, not market prevalence.
- Structured GTM solutions — accessed 9 October 2026. Used for service mapping.